

Oil Mill ROI: 5 Hidden Levers That Separate a 14-Month Payback from a 40-Month One
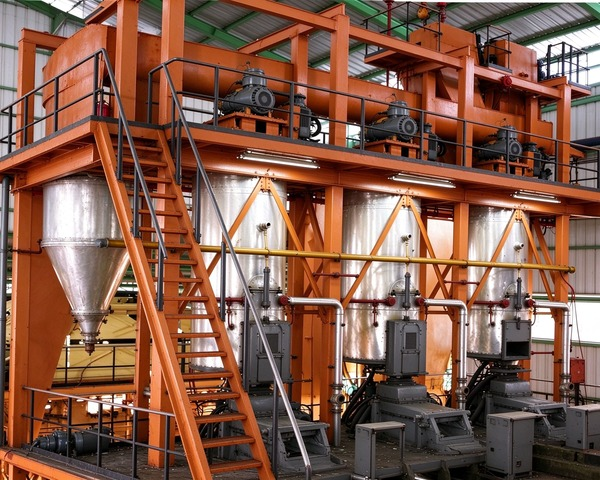
Two oil mill projects. Almost identical equipment lists. Quotations within 5% of each other. One recovers its equipment cost by month 14. The other is still short of break-even at month 40. The feasibility study sitting between them probably projects a payback somewhere in the middle—but it rarely explains why the same machines can produce two entirely different cash-flow curves.
The answer is not the oil price. It is not the feedstock purchase price, either. What drives the divergence are five variables that are absent from both the equipment quotation and the standard ROI template. None of them is loud. Each one keeps re-pricing your payback speed throughout the first 12 to 18 months of operation. Put all five into the same table, and what you get is not “a payback number” but a payback range—and that range is the project’s real margin of safety.
Lever 1 (Supporting): The Decimal Point in Oil Yield, Amplified Non-Linearly by Wear
The ROI impact of oil yield has been discussed enough in this industry. Mechanical pressing recovers roughly 85%–92% of the oil in the seed; solvent extraction pushes recovery to 95%–99%, compressing residual oil in the cake from 6%–10% down to below 1%. That contrast appears in almost every ROI guide, and on its own it is no longer differentiated information.
What gets overlooked is that oil yield is not a constant—it is a function of operating hours.
A 2025 palm oil pressing study documented an unkind curve: as press worm operating hours rose from 368 to 531, the oil loss rate climbed from 5.39% to 7.08%. Once the operating time crossed the roughly 411-hour control threshold, the deterioration accelerated further. After a new press worm was installed, the oil loss rate dropped from 7.66% at the 10-hour mark to 4.16% at 163 hours. The implication for ROI is that wear does not erode returns at a uniform rate—it accelerates after a certain point, and that point arrives well before most “annual maintenance” schedules would catch it.
In engineering practice, the inspection interval for press worms and press rings varies with the feedstock: hard oilseeds may call for a wear assessment every three to six months, while high-impurity feedstock can compress that window further. For a machine that has run more than two years without its core wear parts replaced on a condition-based schedule, an actual oil yield 5 to 8 percentage points below the rated value is not unusual. In ROI terms, the recoverable oil embedded in every ton of feedstock you pay for is quietly shrinking.
This is also why equipment selection cannot stop at comparing rated tonnage. The precision of cleaning and conditioning in the pretreatment section, together with the material and replaceability of wear parts in the press section, jointly determine the slope at which oil yield decays over time. At Huatai Intelligent Equipment Group, the system matching between oilseed pretreatment and the pressing stage treats wear-part serviceability as a design variable for process continuity—rather than leaving it for the operator to chase after production starts. The relevant configuration logic is illustrated in the screw oil press and oilseed pretreatment equipment lines.
Lever 2 (De-emphasized): The “Second Cost Layer” Beyond Feedstock Has Already Been Covered Elsewhere
Feedstock accounts for 85%–90% of operating expenses. That is the structural constraint of oilseed processing, and it needs no re-argument. Transformer upgrades, commissioning-period losses, and by-product discounts—the “hidden costs” in the second layer—have been listed and re-listed across existing English-language content. Expanding on them individually yields little new information.
They still deserve a line in the ROI table. But they should not carry the article. A more useful treatment is to stop treating them as standalone cost items and instead fold them into a correction to “effective production days.” A commissioning delay that pushes stable ramp-up back by three weeks, for example, is equivalent to roughly a 6% reduction in annual effective production days. A capacity constraint from undersized transformer infrastructure directly suppresses peak throughput. Once the second cost layer is translated into an input to the availability assumption, it merges into Lever 3—and Lever 3 is where the real payback gap opens.
Lever 3 (Core Differentiator): Downtime Is Not a Repair Bill. It Is a Cash-Flow Leak.
This is the item that ROI models most systematically underestimate.
Industry cost estimates carry an implicit assumption: the plant runs 99% of scheduled time, 340 to 350 days a year. That benchmark describes a well-maintained machine under ideal conditions—not a real production line under real operating conditions. OEE studies of palm oil pressing equipment have recorded actual overall equipment effectiveness as low as the 43%–77% range, with waiting for spare parts among the main drags on availability. The distance between those two numbers is the most dangerous blank space in an ROI model.
Why is downtime so expensive in a thin-margin business? Because fixed costs do not pause, while gross-profit contribution goes to zero. One quantifiable reference for pricing this: for a medium-scale pressing line, the gross-profit contribution lost per downtime day runs at roughly the $1,500 level. If faults or parts shortages cost two production days a month, the annualized loss is approximately $37,000. That figure never appears on a maintenance invoice, but it is deducted directly from the payback period. In larger continuous oilseed crushing operations, the cost of unplanned downtime rises by orders of magnitude, because an upstream stoppage quickly backs up the downstream continuous stages.
An ROI model therefore needs not a blanket “annual maintenance budget” but an explicit availability scenario. A line designed for 300 days a year loses 15 production days at 95% availability; at 85%, it loses 45. The latter effectively shifts the break-even point upward by roughly 15%—an upward shift that is completely invisible in a spreadsheet built on 99% uptime.
Availability is not something that only enters the picture during operations. It is partly locked in at the selection stage. The replaceability of screw press wear parts and the spare-parts supply rhythm, the difference in failure modes between hydraulic and continuous screw systems, and whether critical wear components are standardized—these choices determine the mean time to repair (MTTR) after commissioning, and MTTR is the direct denominator of availability. Huatai builds the spare-parts list and maintenance windows into project design during turnkey delivery, so that the availability assumption starts as a verifiable engineering parameter rather than an optimistic default.
Lever 4 (Core Differentiator): The Real ROI Meaning of Energy Consumption Is Not on the Electricity Bill
Specific energy consumption per ton of feedstock is certainly worth optimizing. Two-stage pressing runs at roughly 1.8 kWh per kg of oil; single-stage solvent extraction can bring that down to around 1.2 kWh per kg of oil. But for a mill that has already committed to one process route, that cross-route comparison is not the lever available in day-to-day decisions. The real ROI opportunity sits in the energy–quality coupling within the same route.
Take the pressing-to-refining chain. The quality of crude oil entering the refining section directly determines the consumables and refining losses in degumming, deacidification, and bleaching. Research on nano-neutralization deacidification shows that under high-efficiency mixing conditions, alkali consumption can be reduced by more than 30%, while phosphoric acid and citric acid consumption can drop by as much as 90%, without compromising deacidification performance. Cleaner deacidified output also reduces the bleaching earth load in the downstream bleaching stage, creating a second round of consumable savings.
The correct ROI arithmetic for energy optimization, then, is not a standalone “dollars saved per kilowatt-hour” calculation. It is a causal chain linking heat-treatment precision in pressing, crude oil quality, refining consumable consumption, and refining yield. Gentle, precisely controlled conditioning saves thermal energy at the press—and may save again at the refinery in the form of lower alkali consumption, lower bleaching earth consumption, and reduced neutral-oil loss. Overheating or crude conditioning does the reverse: it raises energy consumption, degrades crude oil quality, and inflates refining costs, with all three losses stacking up in the blind spot of the ROI model.
For investors who make decisions in ROI language, the question worth putting to a supplier is not “what is your specific energy consumption per ton?” but “what refining consumable consumption range does your pressing-stage design correspond to downstream?” A process configuration that aligns quality standards across upstream and downstream stages is worth far more than a “low-energy standalone machine” running in isolation. Huatai’s coverage across pretreatment, pressing, extraction, and refining allows this cross-stage quality transfer to be priced into the return calculation at the project-design stage—rather than waiting for the refining workshop to absorb the pressing section’s shortfall through excess consumption. See the stage-interface logic in oil refining equipment and solvent extraction equipment.
Lever 5 (Structural Lever): The Ceiling on Payback Speed Is Set by Expansion Compatibility
The first four levers operate at the operational level. Oil yield, availability, and energy efficiency can all be improved after commissioning through management and maintenance. The fifth lever is different: it is locked in at the moment of equipment selection, and it determines whether the gains from the first four can be diluted across scale.
Small pressing units can pay back quickly. Where feedstock and offtake are stable, equipment investment recovering within months to a year is a real phenomenon. For medium-sized projects benchmarked at 30 TPD, the industry’s static payback reference typically falls in the 1.5-to-4-year range. A good part of the distance between those two numbers is not market-side—it is whether the process architecture supports phased investment.
If the pretreatment equipment at the starting stage has no interface reserved for a future extraction section, if the utilities have no headroom for post-expansion peak load, and if the refining section has no space reserved for continuous upgrading, then expansion means building a parallel system next to the existing asset. The upstream equipment that had already “paid back” does not continue contributing cash flow during the upgrade; it becomes a sunk cost to be bypassed or replaced.
This is compatibility cost: it does not appear on the first equipment quotation, but it surfaces at the moment of the expansion decision in the form of duplicated investment. In an ROI framework, it means payback cannot shorten linearly with output—unit fixed costs rise after expansion rather than fall.
For an oil mill project where ROI is the core metric, the first question in equipment selection is therefore not “how much does this set of machines cost now?” but “how far can this process architecture flex in capacity and product mix without overturning the existing layout?” Huatai’s pretreatment and extraction configuration spans 10 TPD to 3,000 TPD. The ROI significance of that span is not scale coverage for its own sake—it is that investors can advance in phases within the same process logic, so that expansion becomes an increase in the utilization of existing assets rather than their replacement.
Putting the Five Levers into One ROI Table: A Usable Scenario Matrix
A standalone “payback number” creates false precision. A more useful exercise is to set each of the five levers at conservative, base, and optimistic levels, and watch how the payback range moves. The table below is a simplified demonstration framework—the actual values need to be filled with local feedstock prices, oil prices, electricity tariffs, and labor costs, but the structure itself can be used for a pre-quotation self-check.
| Lever | Conservative | Base | Optimistic |
|---|---|---|---|
| L1 Oil yield deviation (vs. rated) | −5 percentage points (wear unmanaged) | −2 percentage points | 0 to +1 percentage point (wear managed) |
| L2 Second cost layer (converted to effective-day loss) | Additional 6% loss of effective days | Additional 3% | Additional 1% |
| L3 Availability (actual production days ÷ design days) | 82% | 90% | 95% |
| L4 Energy–refining coupling (consumables and refining loss deviation) | +15% consumable consumption | +5% | At or below base |
| L5 Expansion compatibility | Expansion requires duplicated investment; unit fixed cost rises | Partial stage expandability | Full-chain phased expansion, no duplication |
How to use it: plug the conservative column into your cash-flow model. If payback remains within an acceptable range under that scenario, the project has a genuine margin of safety. If it only works under the base or optimistic column, the paper ROI depends on a set of assumptions that have not yet been tested. The payback gap between two oil mills often does not come from which column they chose—it comes from whether they knew which column they were choosing.
The Right Starting Point for Selection Is Not Price
The final number for oil mill ROI is the product of oil-yield control precision, the availability assumption, energy–quality coupling efficiency, and expansion compatibility. None of these five levers can be fully corrected after commissioning through “better management” alone. Most of them are written into the structure the moment the equipment list is finalized.
For investors evaluating an oilseed processing project, the first set of questions in a quotation request should shift from “how much does this machine cost?” to “what is the payback range for this line under conservative availability and wear assumptions?” A supplier that can answer that question usually also has the capability to configure pretreatment, pressing, extraction, and refining as a continuous system. That is precisely where Huatai Intelligent Equipment Group enters a turnkey project: not selling the lowest-priced standalone machine, but making the five levers measurable, manageable, and phaseable within a single process architecture. The relevant turnkey capability is described in the Huatai Intelligent Equipment Group project documentation.